Electromyography
Biomechanics (fall 2023)
Introduction:
This lab will focus on the EMG-Force, relationship, electromechanical delay, and EMG-Fatigue relationship of a handgrip experiment.
Methods:
Muscle activity was recorded for the hand grip during isometric contractions and the force data was collected simultaneously using a handheld dynamometer. In the first part of the lab we had our subject do an isometric 100% maximum voluntary contraction (MVC) followed by a 0% MVC, 20% MVC, 40% MVC, 60% MVC, and 80% MVC. After creating those baselines, we had the subject do three isometric contractions with varying intensity. In the second part of the lab, we used the contractions from part one to find the relation between emg_rms to predict the force using the emg_rms of the last three contractions. In the third part, we looked at muscle fatigue
Results:
Graph 1:
The circles represent the average contractions and force for the first 6 contractions. The orange line is the best-fit line I created to fit the data. The force represents the muscle contraction of gripping the dynamometer. The EMG RMS is a method to quantify the amplitude of electrical activity over a time window.
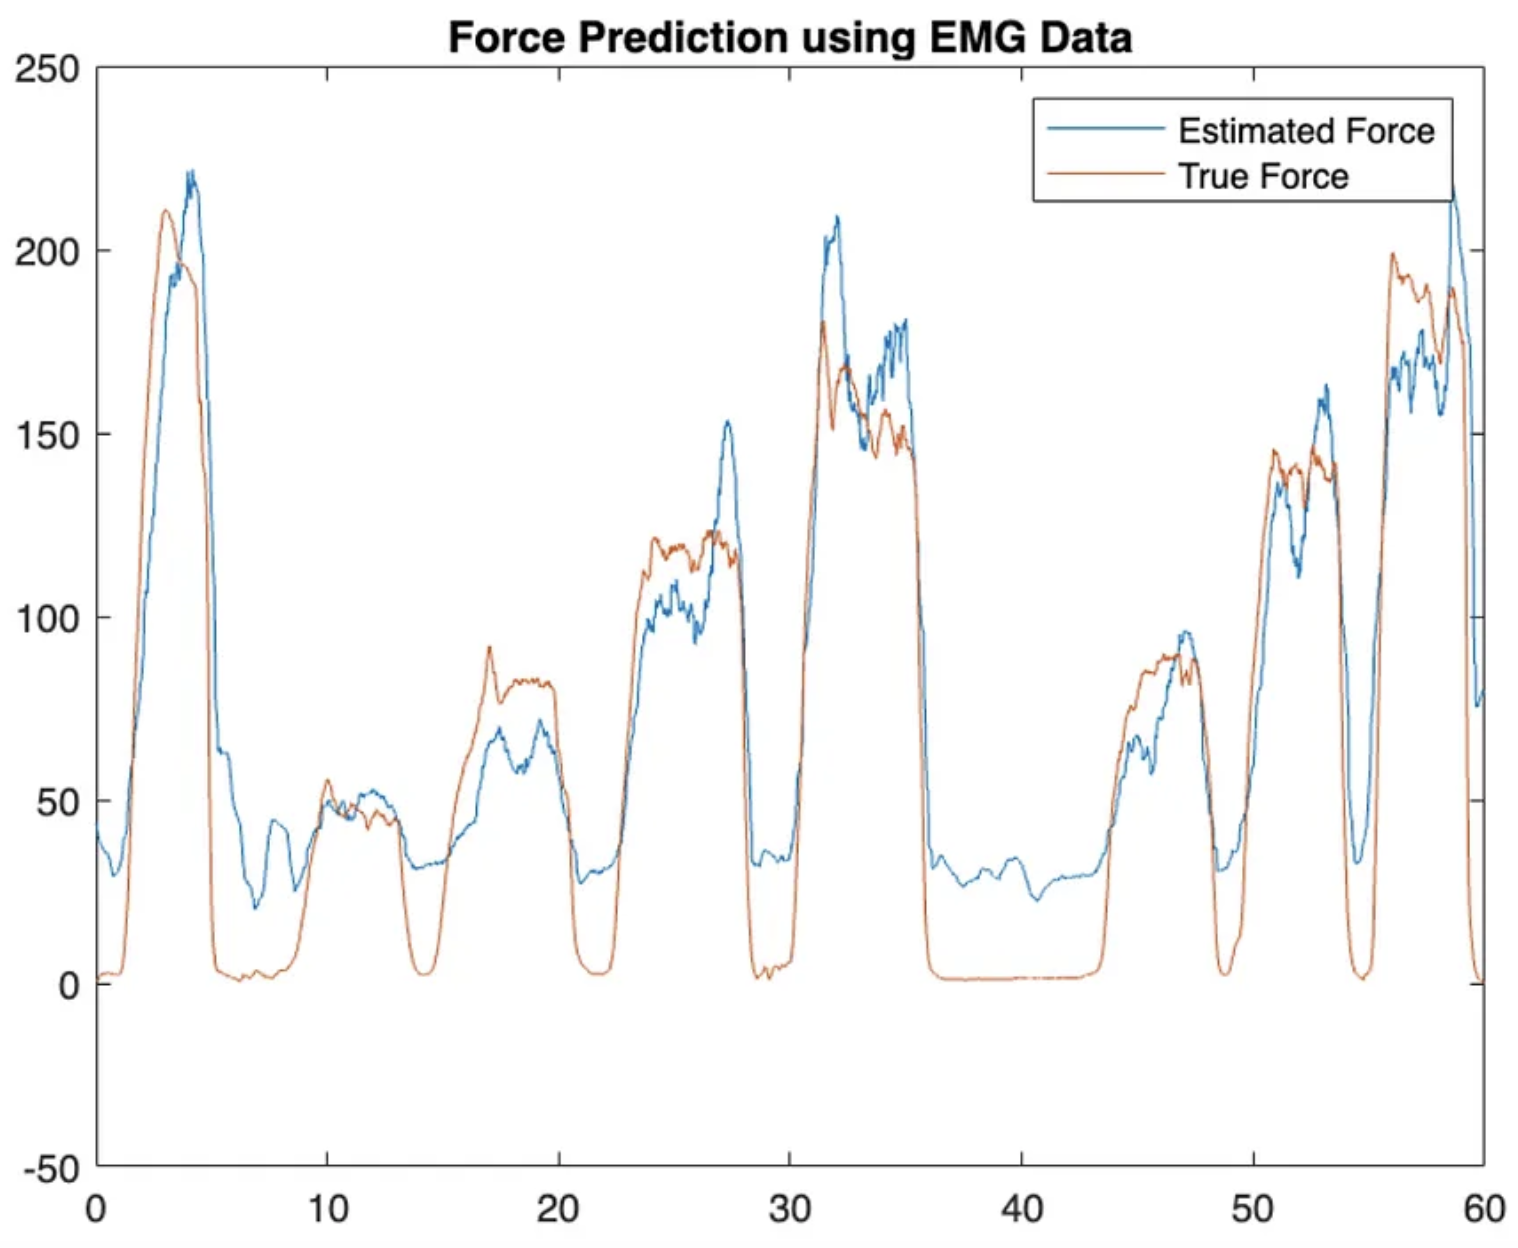
Graph 2:
Using EMG data we predicted the force and we compared it to the actual force.
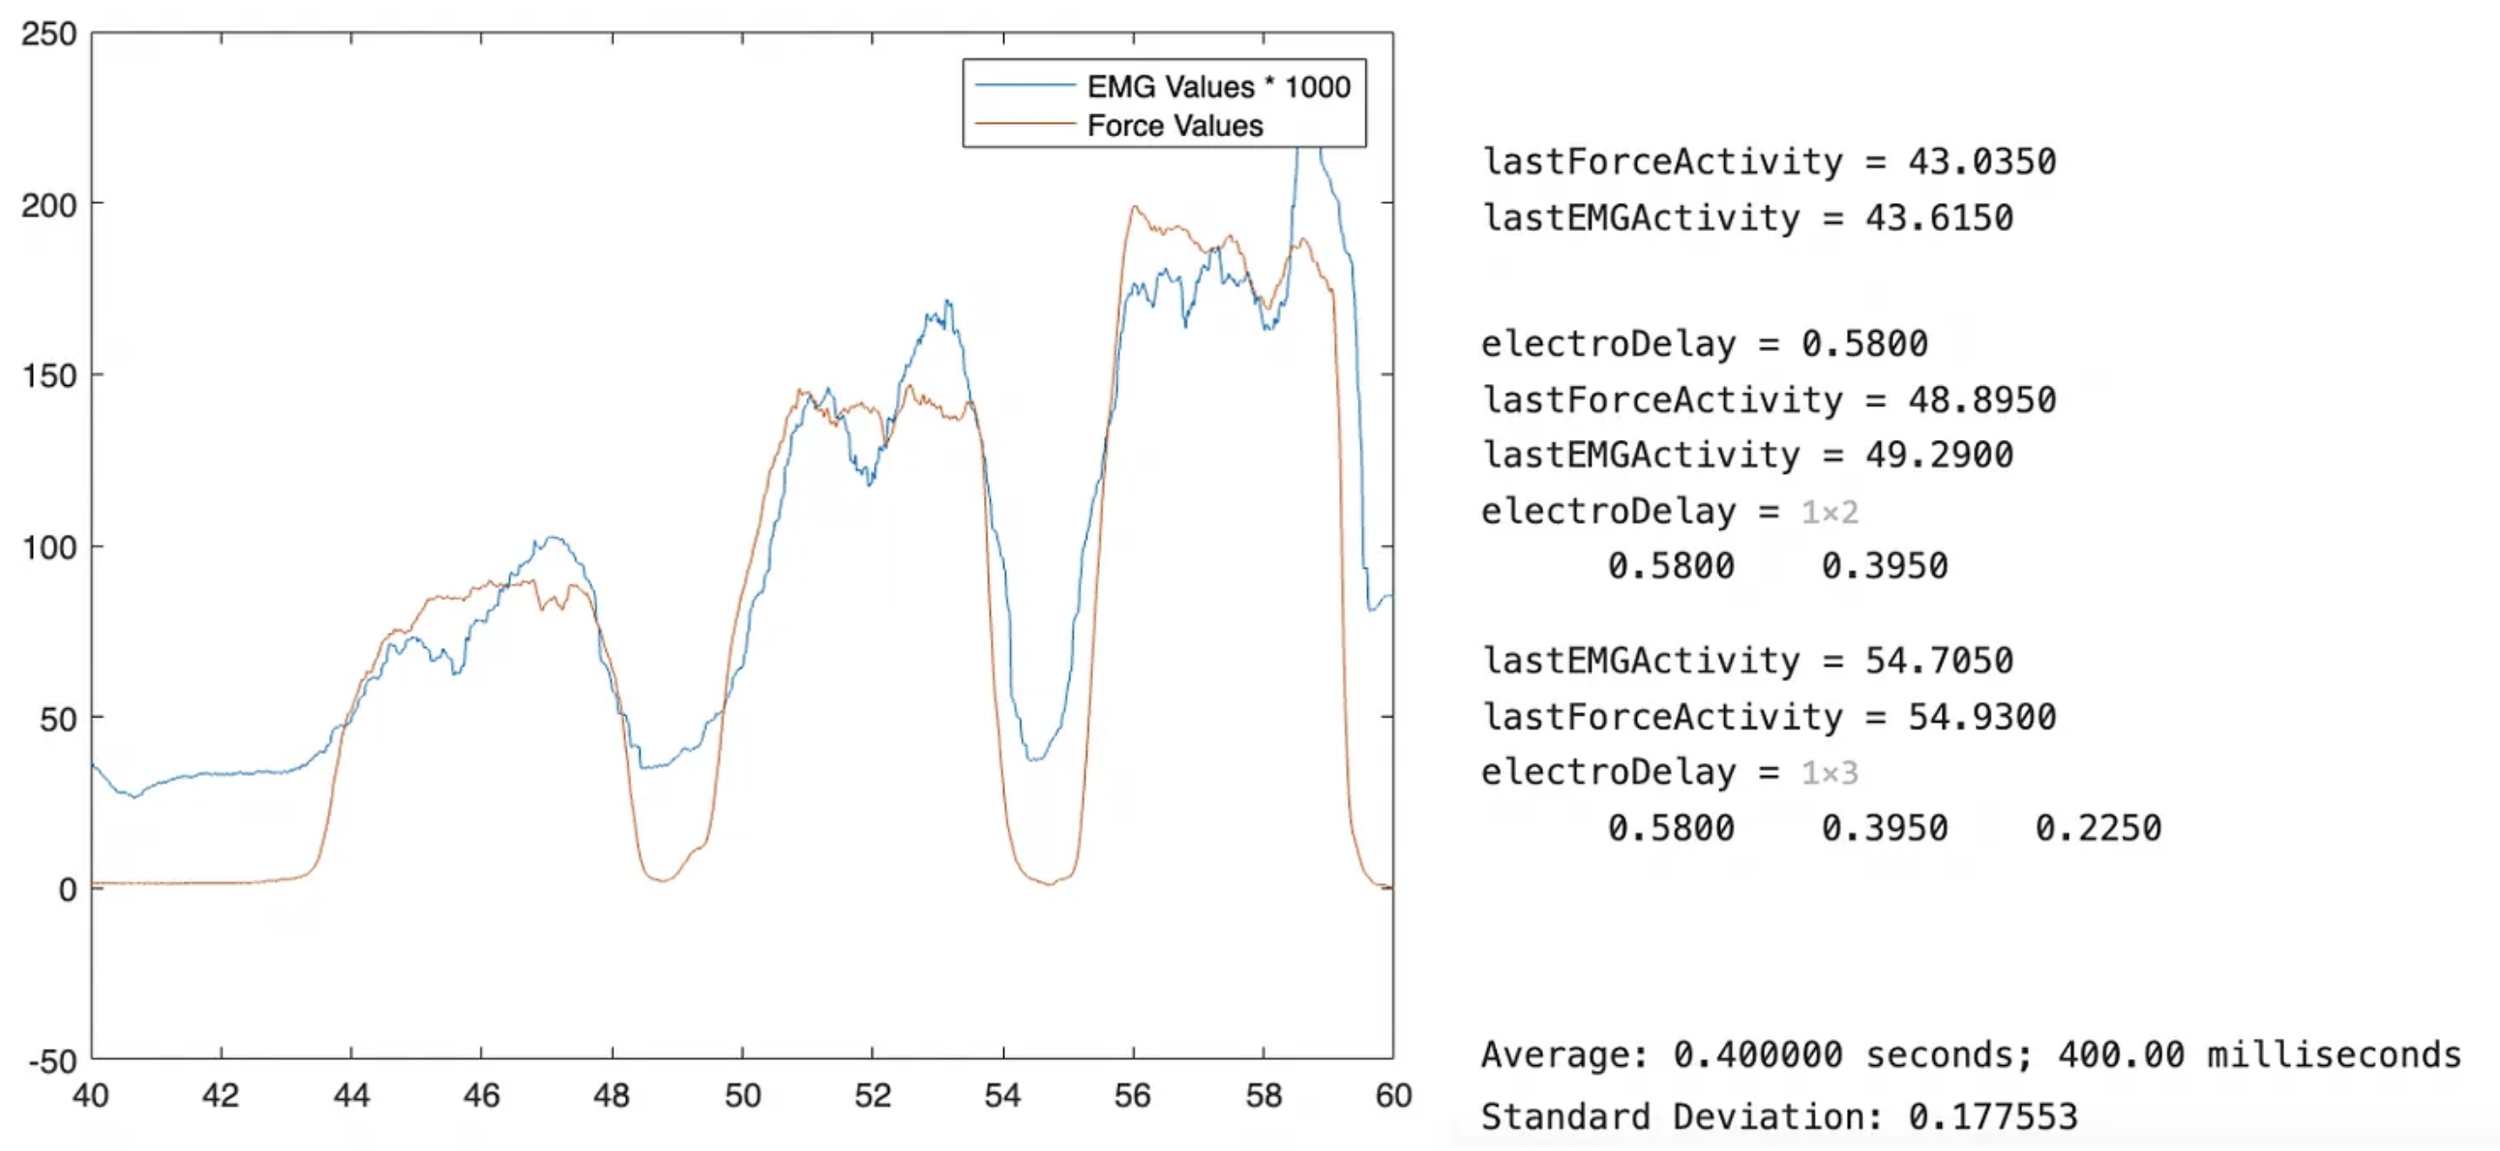
Graph 3:
This graph takes the last three pulses and finds the electromechanical delay between the force and the EMG rms.
Graph 4:
This graph shows the EMG rms at the beginning and the end and compares it to the maximum force.
Discussion:
Since Graph 1 shows an upward-sloping curve, it indicates that as the force applied increases, so does the muscle activation. This is a direct relationship so it means that the harder you squeeze the more your muscles activate. Graph 2 helps continue to show that there is a direct relationship because the estimated and true forces are very similar. They peak and valley at the same time. The third graph shows that there is a delay between the force and the EMG rms, this averages to be around 0.4 secs. The final graph shows that as force goes up over time the EMG rms goes down. This shows that fatigue is happening because it takes more effort to do the same amount of work after a certain amount of time.


